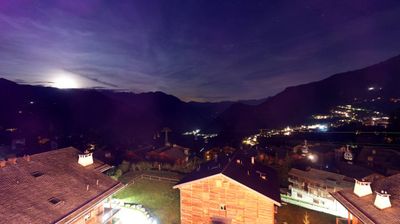
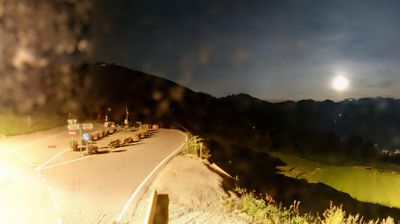
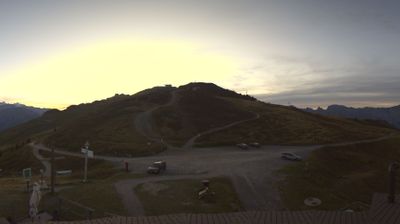
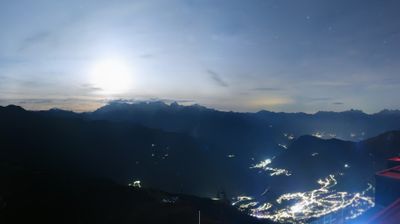
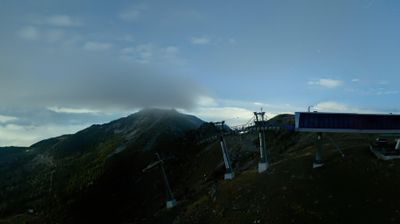
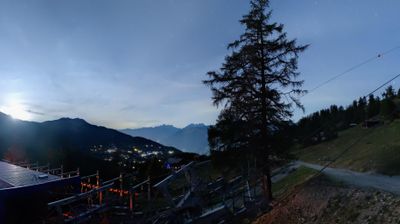
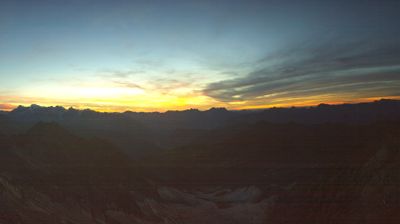
Verbier 1500–3330 m
With it's pretty chalet-style architecture, glorious mountain views, fantastic ski terrain and wild nightlife, Verbier has developed into a glamorous winter playground for anyone who wants to splash the cash. There is no doubt it's an expensive resort, but with it's international clientele, high quality accommodation and superb bars & restaurants, it's almost certainly worth it. Situated in the south-western part of Switzerland in the canton of the Valais, Verbier is bordered by France to the west and Italy to the south. It's about a two hour drive from Geneva airport, or you can take a train directly from the airport to Le Chable, and take the gondola to Verbier from there. Verbier suits both the keen skier, with it's amazing and easily accessible off-piste, and the more leisurely skier who enjoys cruising the blues before relaxing into a sun lounger for the afternoon. The mountain apres-ski bars start the party early, with sound systems pumping out the latest house music to the beat of popping champagne corks. Back in the resort, world famous bars have welcomed royalty and celebrities for many years. You can still enjoy a relatively simple beer and pizza at the end of a day, but the trend is certainly towards a more swanky evening experience.
Forecast
Snow over the next 7 days at the resort height, by model: GFS 0 cm · ECMWF 5.4 cm · AIFS 1.5 cm. This page opened on ECMWF because it is the one forecasting the most — open the other tabs to see how far they disagree.
31 runs of the American model (GFS), started from slightly different data, looking two weeks ahead. The band is how much they disagree — narrow means the forecast is worth trusting. Week 2 is shaded: by then the runs have usually spread so far apart that only the trend is worth reading — is it turning colder, is the freezing level coming down — not the numbers for a particular day.
Modelled on the 00z run (Thu 15 Oct, 00:00 UTC). The next run should reach this page around 14:45 Zurich time.
Nothing here counts as snow: the most any day reaches is 0.6 cm.
The percentage under each day is how many of the 31 ensemble members produce at least 1 cm — the forecast's own confidence.
Estimated for 1,500 m from the model’s own height of 1,494 m, which is the only height it forecasts at. Temperature changes by 0.7 °C for every 100 m, and precipitation counts as snow where that brings it below freezing (about 0.7 cm of snow to each mm of water) — so going up it can only add snow to the model’s figure, and coming down it can only take snow away.
The percentage under each day is how many of the 31 ensemble members produce at least 1 cm — the forecast's own confidence.
Estimated for 2,420 m from the model’s own height of 1,494 m, which is the only height it forecasts at. Temperature changes by 0.7 °C for every 100 m, and precipitation counts as snow where that brings it below freezing (about 0.7 cm of snow to each mm of water) — so going up it can only add snow to the model’s figure, and coming down it can only take snow away.
The percentage under each day is how many of the 31 ensemble members produce at least 1 cm — the forecast's own confidence.
Estimated for 3,330 m from the model’s own height of 1,494 m, which is the only height it forecasts at. Temperature changes by 0.7 °C for every 100 m, and precipitation counts as snow where that brings it below freezing (about 0.7 cm of snow to each mm of water) — so going up it can only add snow to the model’s figure, and coming down it can only take snow away.
The week ahead is running about 2.5 °C above the 1991–2020 average for the date. The dotted line is the average day for each date: the 1991–2020 low around dawn, the high a couple of hours after midday. Both lines are for 1,500 m: the forecast is moved there from the model’s own height of 1,494 m.
The week ahead is running about 2.5 °C above the 1991–2020 average for the date. The dotted line is the average day for each date: the 1991–2020 low around dawn, the high a couple of hours after midday. Both lines are for 2,420 m: the forecast is moved there from the model’s own height of 1,494 m.
The week ahead is running about 2.5 °C above the 1991–2020 average for the date. The dotted line is the average day for each date: the 1991–2020 low around dawn, the high a couple of hours after midday. Both lines are for 3,330 m: the forecast is moved there from the model’s own height of 1,494 m.
850 hPa is a pressure level about 1500 m up, not the ground: air cools roughly 6.5 °C per kilometre, so the freezing level sits about 150 m higher for every degree on that chart. 0 °C there means snow down to about 1500 m; for it to reach Verbier at 1500 m you need about 0 °C, which is the second line on the chart. There is no 850 hPa record to average, so the “normal for the date” line is on the resort temperature chart above instead. The freezing level chart is the more direct read: when the band drops below the resort base line, precipitation is falling as snow in the village. Model grid elevation here is 1494 m.
51 runs of the European model (ECMWF) — another independent ensemble. Read week 2 against the GFS tab: when they lean the same way the trend is worth far more than either on its own, and when they disagree, nobody really knows yet. Week 2 is shaded here for the same reason.
Modelled on the 18z run (Wed 14 Oct, 18:00 UTC). The next run should reach this page around 13:07 Zurich time.
The percentage under each day is how many of the 51 ensemble members produce at least 1 cm — the forecast's own confidence.
Estimated for 1,500 m from the model’s own height of 1,494 m, which is the only height it forecasts at. Temperature changes by 0.7 °C for every 100 m, and precipitation counts as snow where that brings it below freezing (about 0.7 cm of snow to each mm of water) — so going up it can only add snow to the model’s figure, and coming down it can only take snow away.
The percentage under each day is how many of the 51 ensemble members produce at least 1 cm — the forecast's own confidence.
Estimated for 2,420 m from the model’s own height of 1,494 m, which is the only height it forecasts at. Temperature changes by 0.7 °C for every 100 m, and precipitation counts as snow where that brings it below freezing (about 0.7 cm of snow to each mm of water) — so going up it can only add snow to the model’s figure, and coming down it can only take snow away.
The percentage under each day is how many of the 51 ensemble members produce at least 1 cm — the forecast's own confidence.
Estimated for 3,330 m from the model’s own height of 1,494 m, which is the only height it forecasts at. Temperature changes by 0.7 °C for every 100 m, and precipitation counts as snow where that brings it below freezing (about 0.7 cm of snow to each mm of water) — so going up it can only add snow to the model’s figure, and coming down it can only take snow away.
The week ahead is running about 3 °C above the 1991–2020 average for the date. The dotted line is the average day for each date: the 1991–2020 low around dawn, the high a couple of hours after midday. Both lines are for 1,500 m: the forecast is moved there from the model’s own height of 1,494 m.
The week ahead is running about 3 °C above the 1991–2020 average for the date. The dotted line is the average day for each date: the 1991–2020 low around dawn, the high a couple of hours after midday. Both lines are for 2,420 m: the forecast is moved there from the model’s own height of 1,494 m.
The week ahead is running about 3 °C above the 1991–2020 average for the date. The dotted line is the average day for each date: the 1991–2020 low around dawn, the high a couple of hours after midday. Both lines are for 3,330 m: the forecast is moved there from the model’s own height of 1,494 m.
850 hPa is a pressure level about 1500 m up, not the ground: air cools roughly 6.5 °C per kilometre, so the freezing level sits about 150 m higher for every degree on that chart. 0 °C there means snow down to about 1500 m; for it to reach Verbier at 1500 m you need about 0 °C, which is the second line on the chart. There is no 850 hPa record to average, so the “normal for the date” line is on the resort temperature chart above instead. ECMWF's ensemble doesn't include freezing level through our data source, so that chart is on the GFS tab only. Model grid elevation here is 1494 m.
51 runs of ECMWF's AI-based model (AIFS) — another independent ensemble. Read week 2 against the GFS tab: when they lean the same way the trend is worth far more than either on its own, and when they disagree, nobody really knows yet. Week 2 is shaded here for the same reason.
Modelled on the 18z run (Wed 14 Oct, 18:00 UTC). The next run should reach this page around 13:15 Zurich time.
Nothing here counts as snow: the most any day reaches is 0.76 cm.
The percentage under each day is how many of the 51 ensemble members produce at least 1 cm — the forecast's own confidence.
Estimated for 1,500 m from the model’s own height of 1,494 m, which is the only height it forecasts at. Temperature changes by 0.7 °C for every 100 m, and precipitation counts as snow where that brings it below freezing (about 0.7 cm of snow to each mm of water) — so going up it can only add snow to the model’s figure, and coming down it can only take snow away.
The percentage under each day is how many of the 51 ensemble members produce at least 1 cm — the forecast's own confidence.
Estimated for 2,420 m from the model’s own height of 1,494 m, which is the only height it forecasts at. Temperature changes by 0.7 °C for every 100 m, and precipitation counts as snow where that brings it below freezing (about 0.7 cm of snow to each mm of water) — so going up it can only add snow to the model’s figure, and coming down it can only take snow away.
The percentage under each day is how many of the 51 ensemble members produce at least 1 cm — the forecast's own confidence.
Estimated for 3,330 m from the model’s own height of 1,494 m, which is the only height it forecasts at. Temperature changes by 0.7 °C for every 100 m, and precipitation counts as snow where that brings it below freezing (about 0.7 cm of snow to each mm of water) — so going up it can only add snow to the model’s figure, and coming down it can only take snow away.
The week ahead is running about 4 °C above the 1991–2020 average for the date. The dotted line is the average day for each date: the 1991–2020 low around dawn, the high a couple of hours after midday. Both lines are for 1,500 m: the forecast is moved there from the model’s own height of 1,494 m.
The week ahead is running about 4 °C above the 1991–2020 average for the date. The dotted line is the average day for each date: the 1991–2020 low around dawn, the high a couple of hours after midday. Both lines are for 2,420 m: the forecast is moved there from the model’s own height of 1,494 m.
The week ahead is running about 4 °C above the 1991–2020 average for the date. The dotted line is the average day for each date: the 1991–2020 low around dawn, the high a couple of hours after midday. Both lines are for 3,330 m: the forecast is moved there from the model’s own height of 1,494 m.
850 hPa is a pressure level about 1500 m up, not the ground: air cools roughly 6.5 °C per kilometre, so the freezing level sits about 150 m higher for every degree on that chart. 0 °C there means snow down to about 1500 m; for it to reach Verbier at 1500 m you need about 0 °C, which is the second line on the chart. There is no 850 hPa record to average, so the “normal for the date” line is on the resort temperature chart above instead. AIFS's ensemble doesn't include freezing level through our data source, so that chart is on the GFS tab only. Model grid elevation here is 1494 m.
One line per forecast centre, each the latest run of its own model. Where they converge the outlook is settled; where they fan out, nobody knows yet. Untick any model to take it off the charts. AIFS is ECMWF's newer AI-based model; Open-Meteo doesn't publish a standalone deterministic run for it, so its line here is its ensemble's control run rather than a single model run like the other seven.
Run each line comes from: ECMWF 00z GFS 00z ICON 00z UK Met Office 18z Wed Météo-France 00z JMA 18z Wed GEM 00z AIFS 18z Wed. The oldest of these started 6 hours before the newest, so a line that looks out of step may simply be working from older information.
Each line adds up that model’s snowfall as the days go on, so where it ends is the total that model expects. Lines stop where each model’s run does: ECMWF, GFS and AIFS reach two weeks; JMA and GEM stop around day 10, ICON and the UK Met Office around day 7, and Météo-France after about four days. So compare lines where they overlap, not where they end.
Freezing level is not offered here: only GFS and ICON publish it for every hour, so a comparison would be misleading. Use the ensemble view for that one.
Pressure & cloud cover
Windy’s own animated map, centred on Verbier. Open one below, then use the timeline at the bottom of the map to step through the next two weeks, or the layers menu inside it to switch what it’s showing.
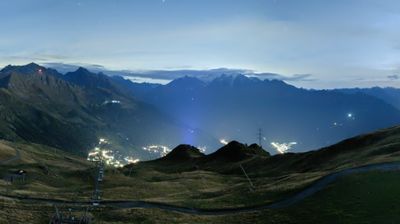
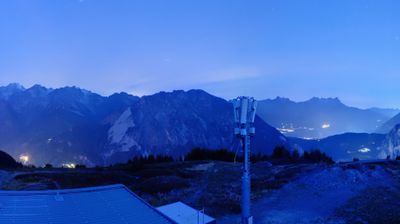
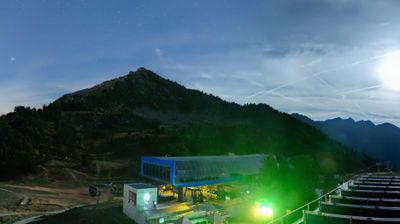
Webcams